The Average Cost Is a Myth: Your Buyer Only Ever Sees One Category
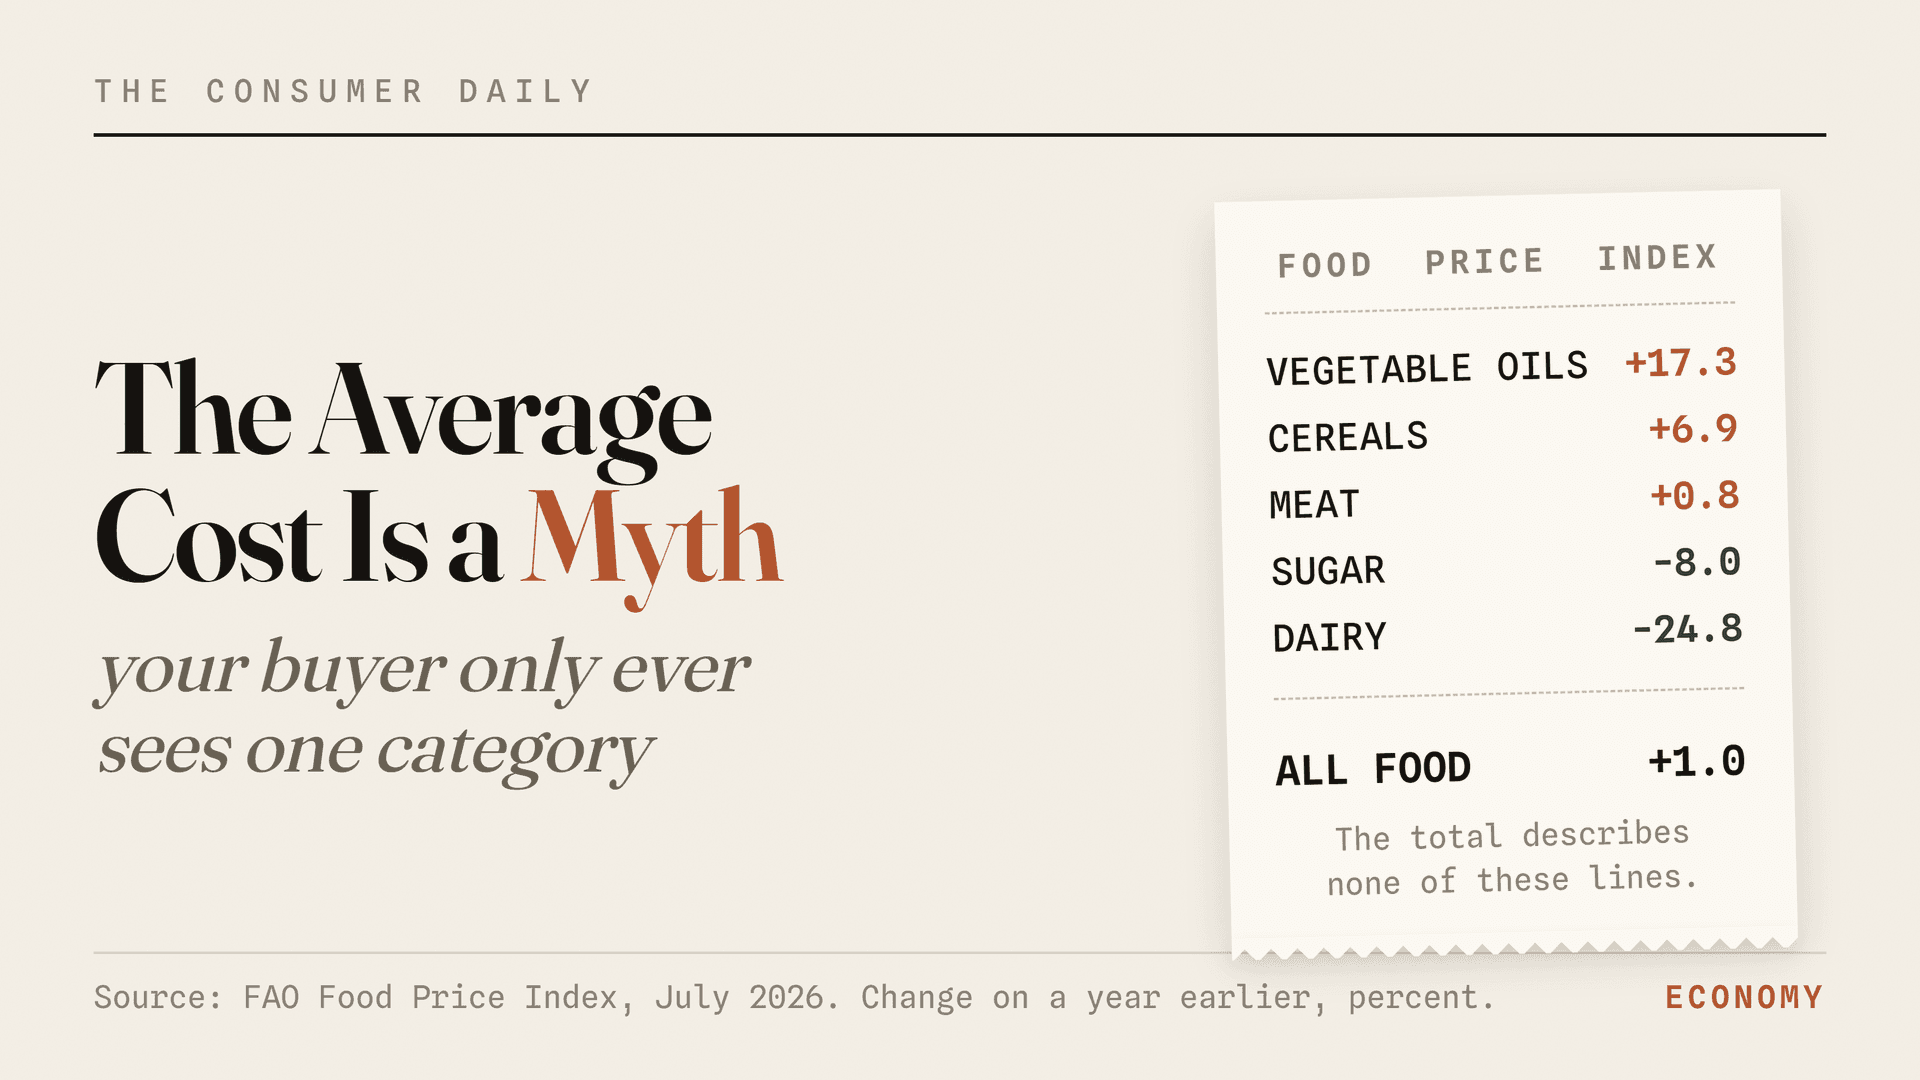
Vegetable oils are up 17 percent over the year while dairy is down 25 percent, and your buyer is only ever allowed to look at one of those lines.
The short version
- Food raw-material costs have stopped moving together. Over the year to July 2026, vegetable oils ran 17.3 percent above where they were, cereals 6.9 percent above, dairy 24.8 percent below, and the headline food index moved just 1.0 percent [1].
- This is not a strange year. Food is the least synchronised raw-material group there is, because weather and government policy drive its supply. A World Bank study of five decades found that one shared worldwide force explains only 2 to 14 percent of how farm prices move, against 18 percent for energy [2].
- The split now turns up inside one company in one quarter. General Mills reported lower input costs in its pet food business and higher input costs in its North America grocery business, in the same release, for the same three months [3].
- My position: the things you have to negotiate for, chiefly the price and terms you win from a retailer, have lost power. The things you decide yourself, which products you push, what pack sizes you sell, what you get listed, have not. Weight should move toward the second group this planning round.
- The reason is not that buyers have turned difficult. Supermarket buying is organised one category at a time, and a buyer is judged on a scorecard built only from their own category. So you hand back the savings where your costs fell, you still have to fight for recovery where they rose, and nobody at the table will let you use one to pay for the other.
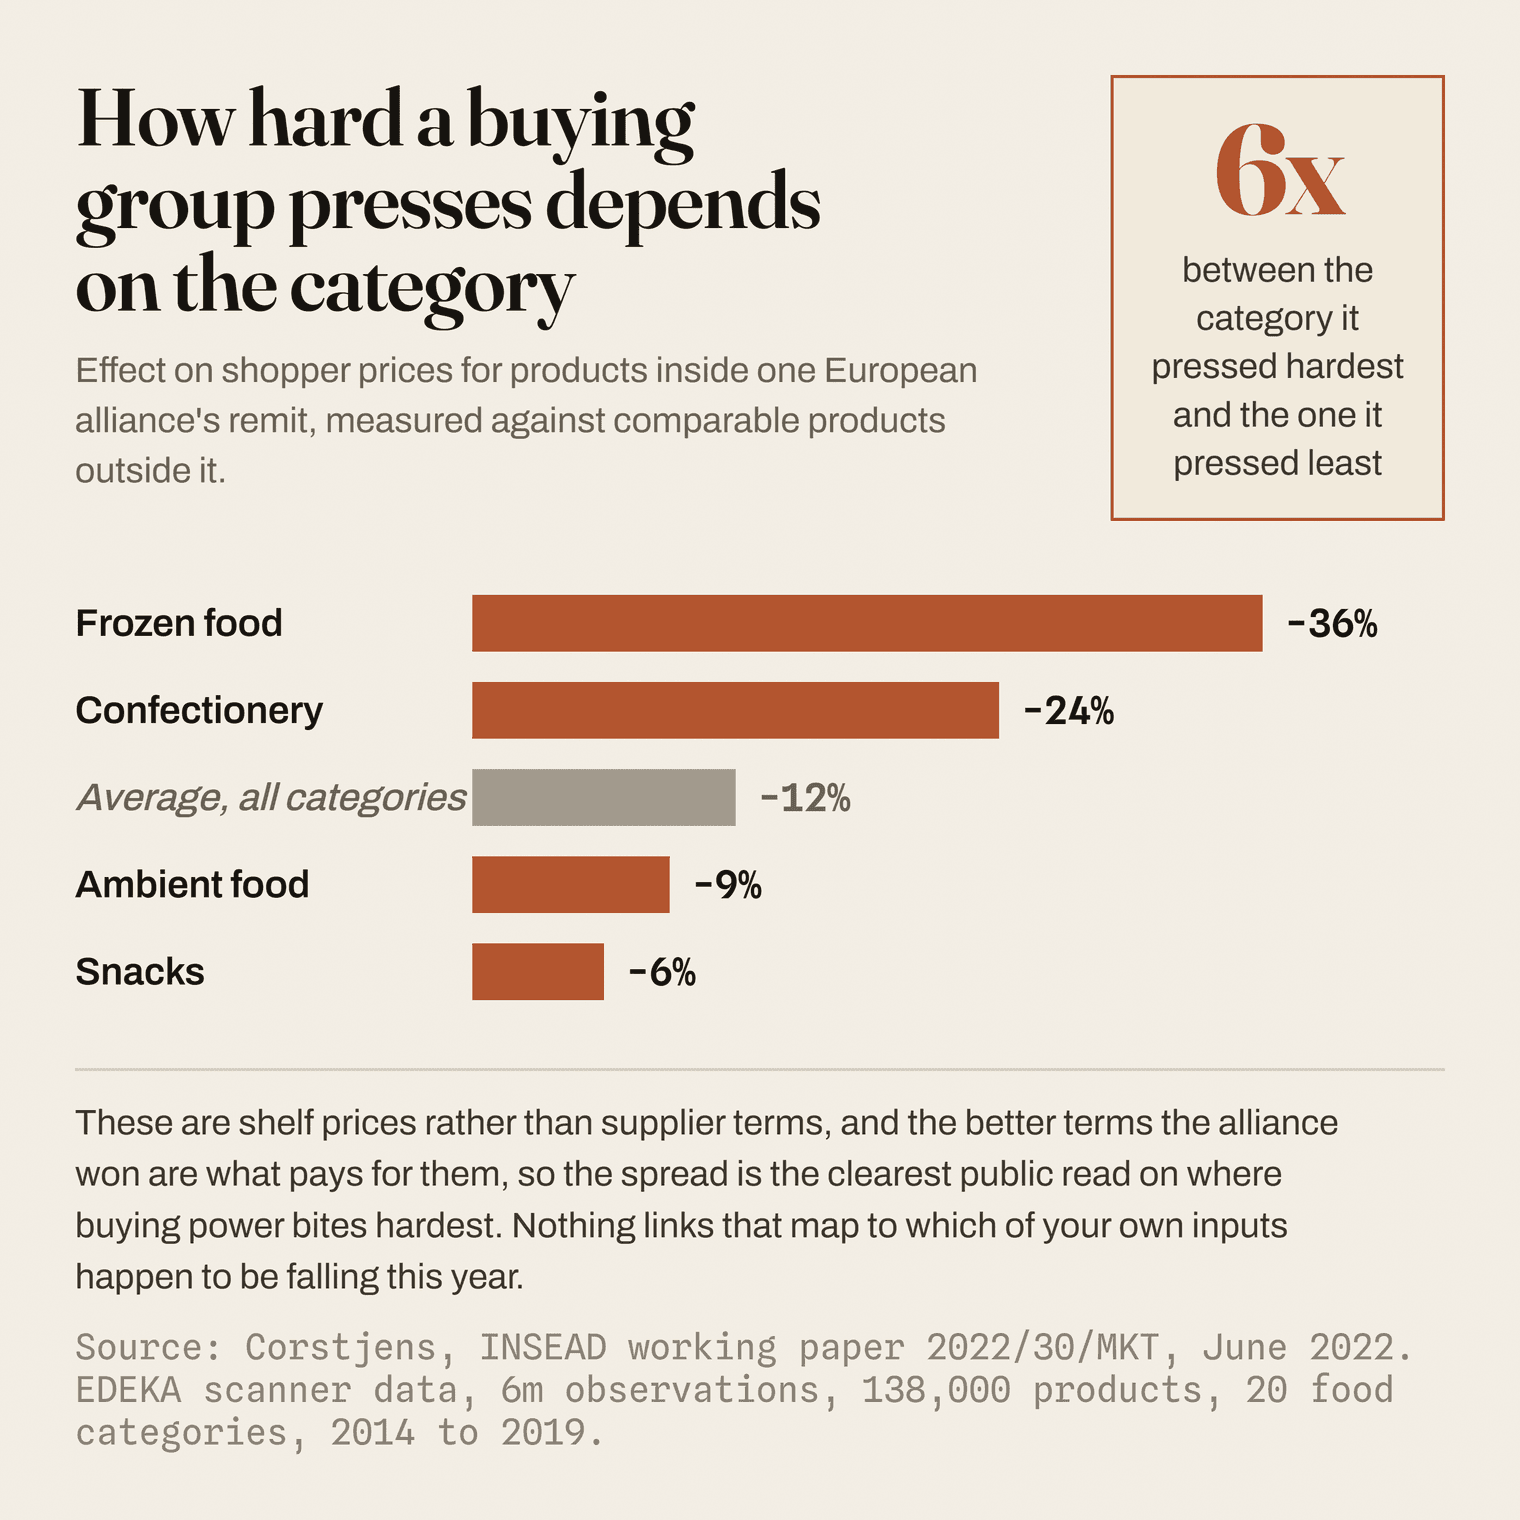
- Whether you keep a cost fall has little to do with its size. Across one European buying alliance, its effect on shelf prices ran from 36 percent in frozen food to 6 percent in snacks [4]. Where your costs moved and whether you keep the move are two separate questions, and most planning asks only the first.
- What would change my mind: a large energy shock pulling every food commodity back into line. Energy softened in June and firmed in July, and the split survived both, which I go into at the end along with the thing I would watch next.
Why does the headline food number describe nobody?
Look at the July 2026 food price index the way a buyer looks at it, one line at a time.
The headline says food prices rose 1.0 percent over the year [1]. It is a calm number, and you could build a calm story around it. Plenty of people have.
The lines underneath are a different matter. Vegetable oils sat 17.3 percent above where they were a year earlier, at their highest level since June 2022. Cereals were up 6.9 percent, meat up 0.8 percent. Then dairy sat 24.8 percent below its level a year earlier, and sugar 8.0 percent below [1]. That is a spread of 42 percentage points between the top and the bottom of the same index, in the same month.
The 1.0 percent is real. It is also an average of things with almost nothing to do with each other, and I cannot name a company whose actual cost base it describes. If you make cooking oil you are living in a different economy from the person making cheese, and you are both filed under "food inflation" in the same sentence of the same news report.
The reasons behind the lines have nothing in common either. Taking the moves the index recorded that particular month, wheat rose 5.8 percent on disrupted shipping out of the Black Sea, damage to export infrastructure, and heatwaves in several growing countries. Palm oil rose for a second month running on demand from Indonesia's biodiesel sector, biodiesel being the fuel made from crop oil. Dairy fell because butter and milk-powder supplies improved in Europe and Oceania. Sugar rose on hot dry weather in the European Union and on Brazil temporarily raising the share of ethanol it requires in petrol [1]. A war sets one line, a fuel mandate sets another, a dairy herd sets a third, and a heatwave sets a fourth, and all of them get averaged into the same number.
Is this a strange year, or is this what food always does?
I assumed for a long time that 2021 to 2024 was the normal state and that what we have now is the disturbance. That is backwards.
A World Bank study of raw-material prices from 1970 to 2021 measured how much of each commodity's movement can be traced to a single shared worldwide force. For energy, that force accounted for 18 percent of the variation. For base metals, rubber and platinum, 22 to 37 percent. For farm commodities, only 2 to 14 percent [2].
The study is direct about why. In agriculture, supply shocks driven mainly by weather and policy "dwarf demand shocks" [2]. A drought does not care what oil is doing. An export ban lands on one crop. A herd rebuilds on its own schedule. Food is made of thousands of separate biological and political events, and they do not coordinate.
The years when everything moved together were the anomaly. Almost every commercial playbook now in use was built during it, when you and your customer were reading the same story off the same page.
Can one company have costs going both ways at once?
Yes, and you can now watch it happen inside one document.
General Mills, reporting the quarter that ended on 31 May 2026, explained its pet food business as driven by "favorable net price realization and mix and lower input costs". In the same release, for the same quarter, its North America grocery business was "partially offset by lower volume... and higher input costs", and its international business likewise by "higher input costs" [3]. That is one company, in one quarter, in one press release, with the cost of raw materials falling in one part of the business and rising in another.
The scope matters here. This is a quarterly picture, and across the full financial year the same release puts the pet food business on higher input costs too [3], so anyone citing it as a settled annual pattern is overreaching. What it shows is that the split has become fine-grained enough to appear and disappear inside a single company's own reporting periods.
Danone shows the same fracture from another angle. Its dairy margin fell while its water margin rose, and the distance between the two widened by roughly 2.6 percentage points in six months [5]. Danone gives no reason for the dairy move at that level, so this is not evidence about raw-material costs specifically. What it does show is that the economics of separate parts of one portfolio are now pulling apart fast enough that a single company-wide margin number tells you very little about the businesses underneath it.
The margin bridge, and why one cost line breaks it
A margin bridge is the standard finance tool that explains why profit moved, by splitting the change into how much came from price, how much from how much you sold, how much from a shift in which products sold, and how much from what it cost to make them. Almost every version carries one line for the cost of making things, on the assumption that costs move one way for the business as a whole. When your categories move in opposite directions, that single line stops meaning much, and the bridge starts crediting good commercial work to whichever part of the business happened to be selling the cheap-ingredient mix.
Why is your buyer only ever allowed to look at one of your categories?
This is the part that changed how I think about the problem.
The obvious worry is that a buyer will net your falling costs against your rising ones. If oils are up and dairy is down, surely they average the two and tell you that you have nothing to complain about.
They do not, and they cannot, because of how supermarket buying is built. Retailers organise buying around the merchandise category, meaning the set of products shoppers treat as swaps for one another. That is the planning unit, and organising buying by supplier or brand instead goes wrong quickly, because a brand-organised team ends up stocking three versions of the same thing without anyone noticing. So the person who negotiates your dairy business and the person who negotiates your oils business are two different people, working to two different plans, who may never discuss you.
That sounds like good news for you, and it would be, except for how those people are measured.
A buyer is judged on the margin their category returns for the stock it ties up, and the reason the measure is built that way is deliberate. It uses only what a buyer actually controls, which is their own category's margin and their own category's stock. A buyer does not control the rent, the checkout staff, the lorries or the cash.
Follow that through to the thing that costs you money. Say your oils business needs a price increase and your dairy business has seen its costs fall. You will be asked for the dairy saving by the dairy buyer, who can see it. You will separately have to win the oils increase from the oils buyer, who has no reason to grant it and no visibility of what you just gave away down the corridor. You give back the falls and you still fight for the rises, and there is nobody in the building whose job it is to let you settle one against the other. When you walk in and explain that oils are up 23 percent, you are asking a dairy buyer to accept a worse number on the only scorecard they have, in exchange for a benefit that lands somewhere else in their own building, on someone else's plan, and never appears in their review. When they decline, they are doing their job correctly, and the incentive is working exactly as it was built to work.
It is also worth knowing how little room they have. Through the last big cost shock, grocery retailers were running operating profit margins of around 3 percent while brand owners ran near 19 percent [6]. The person refusing your increase is defending a far thinner position than the one you are arguing from.
That tells you which arguments to stop building. Any case that needs your counterpart to think about your whole portfolio will fail however well you construct it, because you are asking them to be worse at their job. The arguments with a future are the ones that improve their category's number.
The buyer's scorecard
Supermarket buyers are judged on the margin a category earns for every pound of stock it ties up, a measure usually shortened to gross margin return on inventory investment. It is the margin percentage multiplied by how fast the stock sells through. Retailers like it because it compares a slow-moving, high-margin category fairly against a fast-moving, low-margin one, and because it is built only from things a buyer can influence. There are two ways to improve it. Sell the stock faster, or widen the margin, and one well-worn route to a wider margin is giving more of the category to the retailer's own brand.
That last line deserves a moment. One of the two ways a buyer lifts their number is buying more cheaply, and expanding the shop's own brand is the textbook route. Now ask which of your categories is the easiest place for a retailer to expand their own brand. It is the one where the raw material just got cheaper, because it got cheaper for them too. The cost fall you were hoping to hold onto is the same event that improves the business case for the retailer's own-brand version of your product.
A buying group
A buying group is a coalition of retailers, often spread across several countries, that pools its purchasing so it faces a supplier as one large customer instead of several smaller ones. The point is leverage: one negotiation, one set of terms, applied to a much bigger volume. They have become a serious feature of European grocery. They still tend to negotiate category by category rather than across a supplier's whole range, so their scale has not so far turned into an ability to set one of your categories against another.
Which of your categories actually gets to keep a cost fall?
The planning usually goes wrong at this point, and the error is a subtle one.
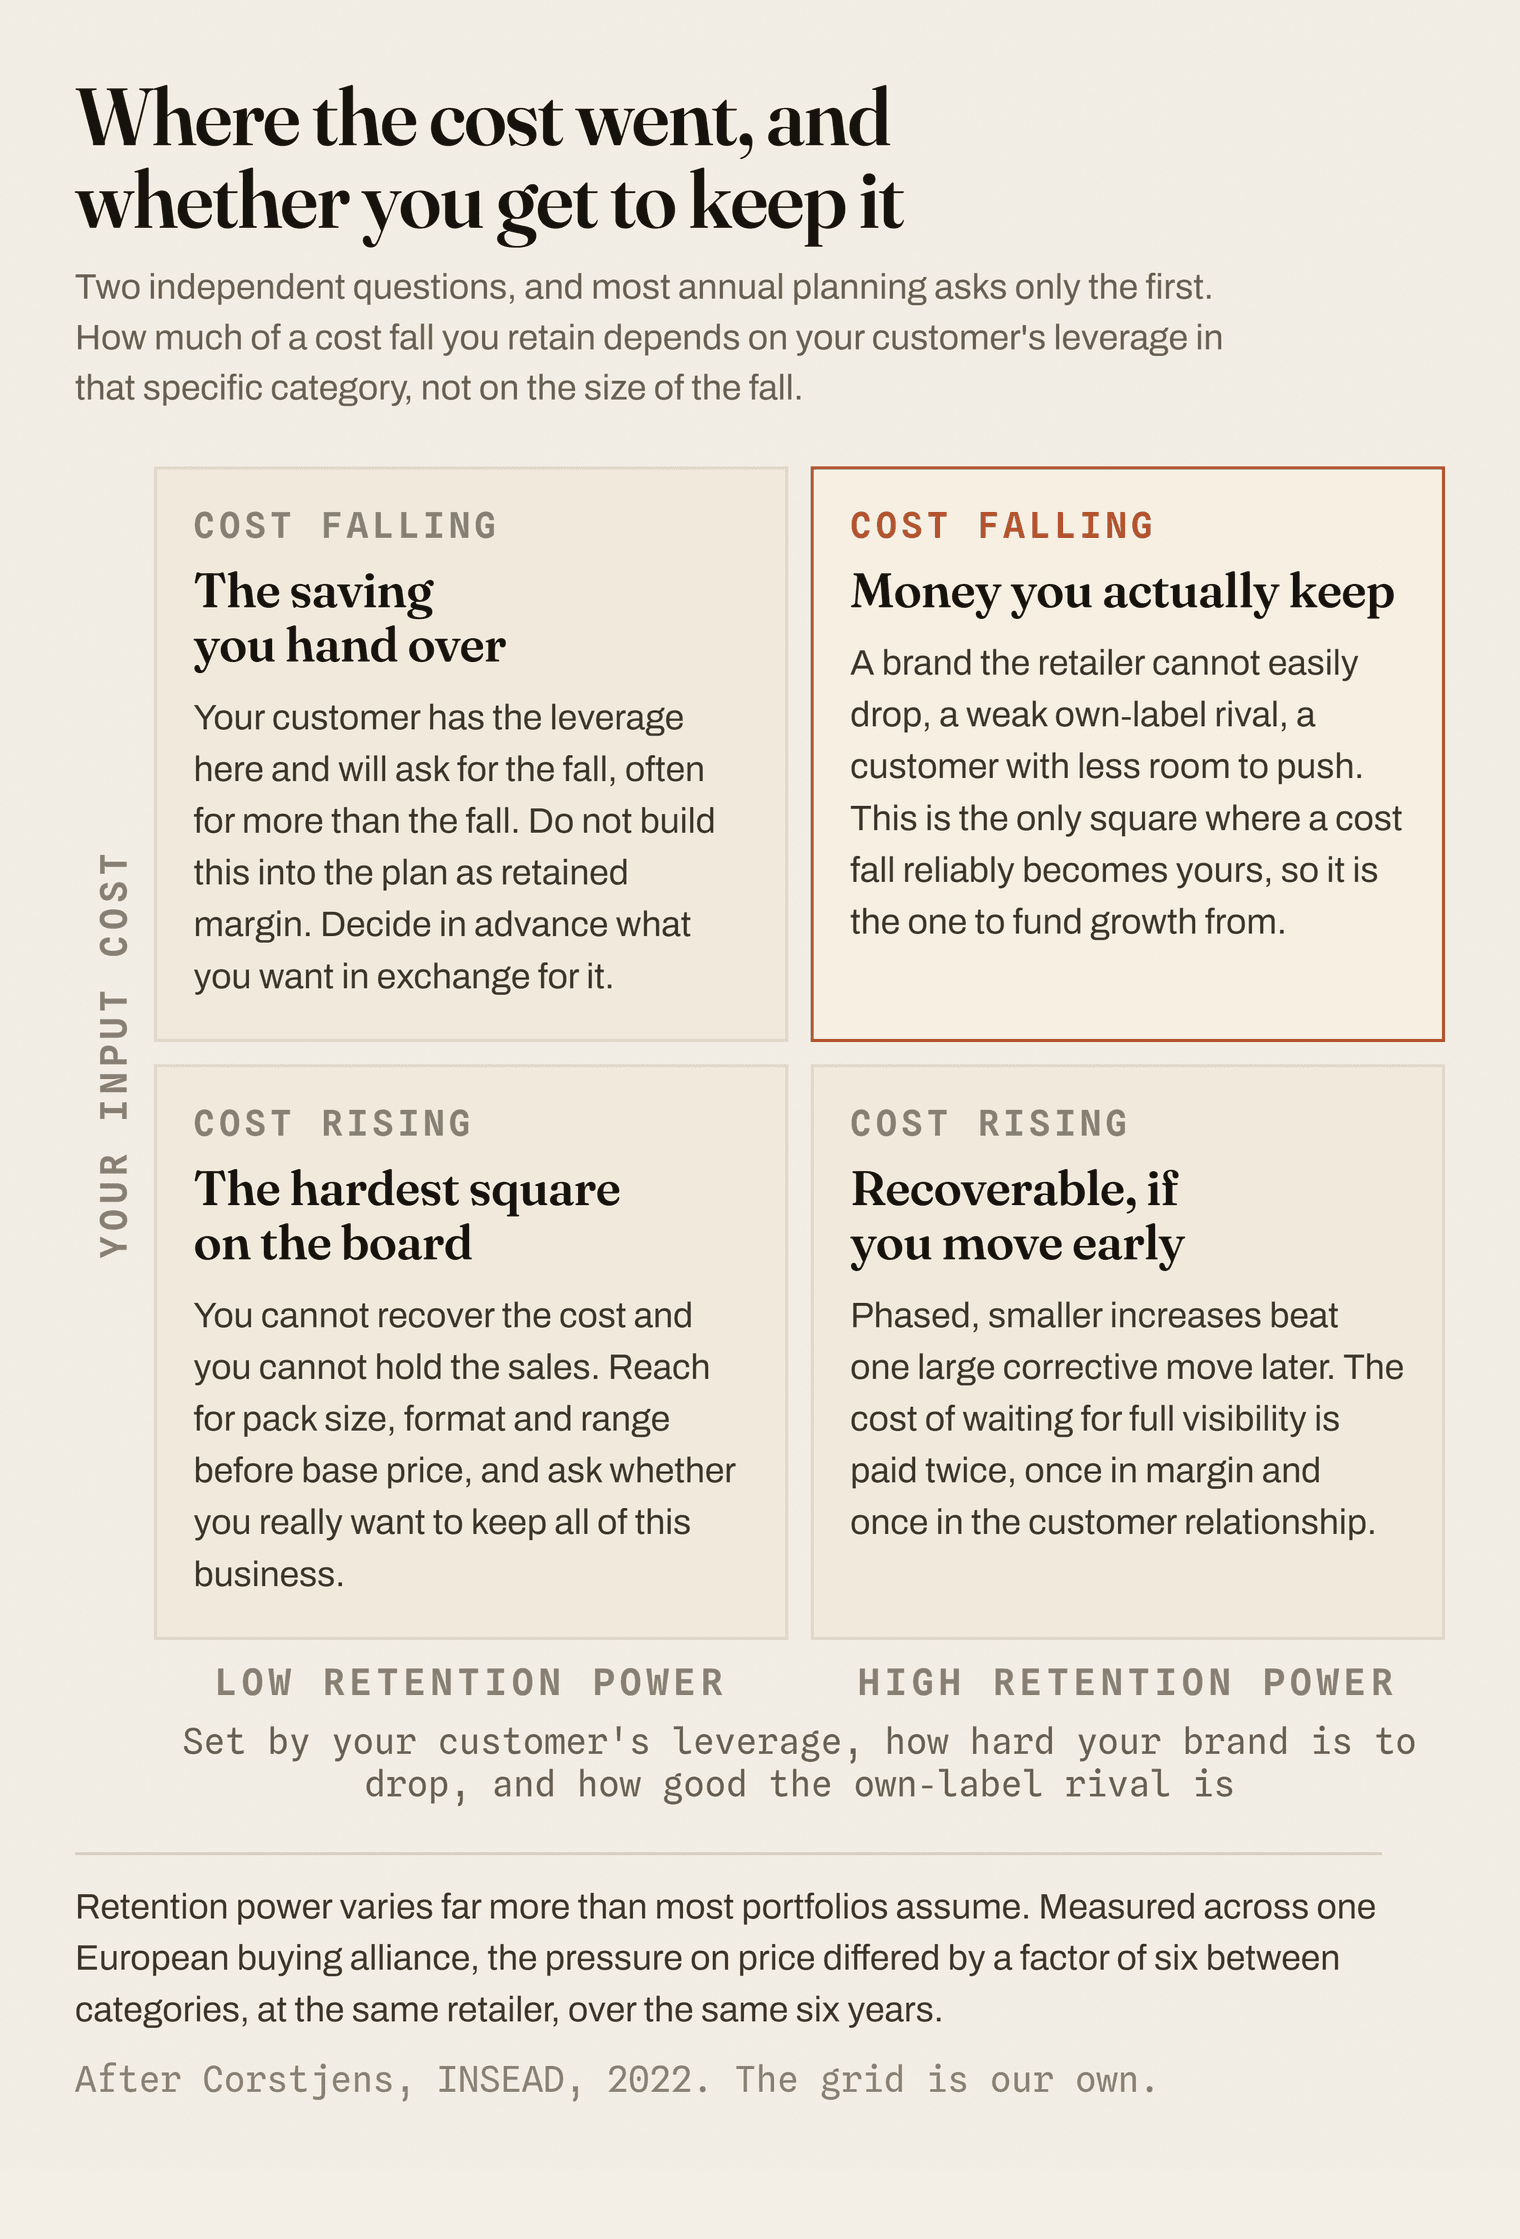
When costs fall in a category, the instinct is to treat that category as having become more attractive. Sometimes it has. Often it has not, because whether you keep a cost fall is a separate question from whether you had one, and the answer depends on how much leverage your customer has in that particular category.
There is good evidence on how much that varies. An INSEAD study looked at what happened to shelf prices when Germany's largest grocer joined an international buying alliance, using checkout data covering more than 6 million observations, about 138,000 products and 20 food categories between 2014 and 2019 [4]. Once the work corrected for the fact that alliance products are disproportionately best-sellers that any retailer keeps keen on price anyway, the average effect was 12 percent lower shelf prices.
Two things about that number before it does any work. It measures what shoppers paid, not what suppliers conceded, and the better terms the alliance won are what pays for the reduction, so pass-through is real but never one for one. And the alliance studied is one that grocer has since left. Neither point disturbs what makes the study useful, which is the range rather than the average.
The effect ran from 36 percent in frozen food down to 6 percent in snacks, with confectionery at 24 percent and shelf-stable food at 9 percent [4]. The pressure a single alliance could bring varied by a factor of six across categories of the same retailer, in the same country, over the same six years.
Nothing connects that map to the map of which of your inputs happen to be falling this year, so the two are independent, and divergence does not weaken you evenly across the portfolio. It rolls dice on which part of your business takes the hardest ask.
A cost fall in a category where your customer has real leverage is a saving you will hand over, possibly with interest. The same cost fall in a category where you hold a brand the retailer cannot comfortably drop from its range is money you keep. One commodity move produces two opposite commercial outcomes, and what separates them has nothing to do with the commodity.
So the useful planning question holds two things together: where did the cost move, and how much of any move do I actually retain there? Score your categories on both and the picture reorders itself. Some of the businesses that look like this year's winners on a cost chart are the ones about to fund your customer's margin instead of yours.
You built an inflation playbook. Is this an inflation problem?
I think the answer is no, and the closest match is something most food companies have filed under a completely different heading.
Simon-Kucher argues that inflation-era pricing logic no longer applies to a tariff shock, because tariffs "strike unevenly and unpredictably, redrawing cost structures and distorting market dynamics overnight", landing on particular categories and trading relationships without warning and sometimes while goods are in transit. Their sharpest line is about the internal response: if teams treat the new shock "as just another flavor of inflation, they're likely missing critical nuances and applying tools designed for a completely different challenge" [7].
Read that with food commodities in mind. It lands selectively, on particular products, and it opens sharp cost gaps between competitors depending on what each of them happens to make.
The cost shock now arriving in food has the shape of a tariff shock, and there is no tariff involved. The toolkit assembled between 2021 and 2024 was built for a broad synchronised move with a single story attached, and it is aimed at the wrong target. The comparison never gets made because the word "tariff" does not appear anywhere near a dairy contract, so nobody thinks to look on that particular shelf. (Which is, I admit, an odd sentence to write in a grocery piece.)
The same firm's read on the current cycle describes the pricing environment as "increasingly fragmented, with cost pressures varying significantly across categories, inputs, and regions", with some parts of a business benefiting from easing raw-material costs while others face sustained increases [8]. That is the fragmentation running along one axis.
The second axis runs the other way, from the same source. In Europe, the growing influence of buying groups "requires a more consistent pricing logic across countries", and country-by-country decisions without a coherent overall rationale are "becoming increasingly difficult to sustain" [8].
Put the two together and the squeeze is visible. Your cost reality is fragmenting across categories at the same moment your pricing freedom is being compressed across countries. You are being asked to tell one consistent, defensible story across markets, precisely when your cost base has stopped supporting one story at all.
So do you hand the saving back?
This is what the whole thing has been building toward, and it deserves a specific answer.
On base price, meaning the everyday shelf price before any deal, no. Base price is the one lever you cannot cheaply un-pull. Reversing an increase takes real discipline, frequent changes confuse the market and weaken your credibility, and managing flexibility through promotions or which products you push is usually more effective and less disruptive [8]. Cut base price on the strength of a falling input and you have made a near-permanent decision on the back of a number that the last five years suggest will move again.
Lindt shows what a base-price move actually costs right now. It lifted prices across the group by 11.8 percent in the first half of 2026 and gave up 7.5 percent of its sales volume and product mix to do it, landing at 4.3 percent underlying sales growth [9]. That is the exchange rate on taking price in a category where shoppers are paying attention.
The exchange rate does not run both ways, which is the part that should make you cautious. When shoppers move to a supermarket's own brand, they largely stay there. Simon-Kucher's shopper work found that if prices come back down, only about a quarter of consumers say they would return to brands [10]. Sales you give up on price are not sitting in a holding pattern waiting for you to reclaim them.
There is a second reason to hold, and this one comes from the shopper rather than the buyer. In 1986, Kahneman, Knetsch and Thaler ran telephone surveys asking the public to judge pricing decisions as fair or unfair. People accept a company raising prices when its profits are threatened, and they accept a company choosing, in the authors' own words, "to maintain prices when costs diminish" [11]. What the public objects to is a company exploiting a shift in demand to charge more.
So the shopper is not the one asking for the money back. Holding your price while an input falls is close to the most defensible position available in the public's own terms, provided you are not seen to be profiting from a squeeze. The pressure to hand it over comes from the buying office.
What shoppers count as fair
Ask the public to judge a pricing decision and a consistent pattern comes back. A price rise that covers a real increase in costs reads as fair. A company holding its price steady when its own costs fall also reads as fair, because nobody has been taken advantage of. What people object to is a company using a sudden shortage or a jump in demand to charge more simply because it can.
Through promotions and which products you push, yes, and deliberately. Promotions can act as a controlled pressure valve, holding sales up while your price position stays where it is [8]. Under a cost picture that keeps changing direction, a valve is worth more than usual.
One caution the standard advice tends to skip. Leaning on promotions has a delayed cost, because heavy discounting drags down the price shoppers carry in their heads as normal. You are trading a near-term problem for a slower one, in the categories least able to afford weaker pricing later. Do it with an end date rather than as a new baseline.
Then the group that is genuinely more within your control: which products you push, what pack sizes and formats you sell, and which of your range you fight to get listed. I want to be precise about this, because it is where a commercial director will object first. None of it is unilateral. A new pack size still needs a listing decision, and that decision runs through the same category buyer on the same scorecard as everything else. The narrower claim is the true one, and it is still worth acting on: none of these depends on winning the cost-recovery argument, which is the argument that just got harder. If your annual plan puts most of its expected value on the price you win from customer negotiations, it was written for the previous decade and is worth reweighting before the next round rather than after it.
One more asset has become worth something. When everyone read the same headline index, the negotiation was a fight over how to divide one visible number that both sides could look up. When the headline describes nobody, knowing your own cost position accurately, category by category, is an advantage your counterpart cannot simply look up.
What would have to be true for me to be wrong?
The clean way to break this argument is a large energy shock. Energy feeds fertiliser, freight, processing and packaging, so it is the one input that could in principle pull every food commodity back into line at once. If that happens, the categories move together again, one story becomes available again, and the levers you negotiate for regain their power. The World Bank chapter notes that prices "frequently move in tandem, especially during periods of major economic upheaval" [2], though the example it reaches for is a demand collapse rather than an energy spike.
What makes this more interesting than the usual hedge is that the test has now run twice, in opposite directions, and I did not have to wait long for either.
In June, energy softened. FAO put part of the fall in wheat down to a stronger dollar and to easier energy markets, on expectations of reduced tension around the Strait of Hormuz [12]. The lines did not converge. FAO's own title for that release was that the index had edged down "amid diverging commodity price movements" [12].
In July, energy did the opposite. The same index credits the rise in maize partly to "spillover effects from firmer energy markets amid heightened geopolitical tensions", and the rise in palm oil partly to higher crude oil prices [1]. Energy reaches every line on the index in theory, through fertiliser, freight, processing and packaging. It moved up, and it moved up in the month dairy fell again and meat posted its first monthly decline of the year. When the index accounted for itself, energy showed up against two lines and the rest went their own way regardless.
One thing did move against me, and it is worth putting a number on. The spread between the top and the bottom of the index narrowed, from about 48 percentage points in June to about 42 in July. All of that came from the top and the middle. Vegetable oils eased from 23.3 percent above a year earlier to 17.3 percent, meat from 4.2 percent to 0.8, sugar from 13.1 percent below to 8.0 below. The bottom did not move at all: dairy was 24.8 percent below a year earlier in June and 24.8 percent below in July. So there is some narrowing, one month of it, in a spread still wide enough to describe two different economies.
That is a falsifier fired under better conditions than I could have arranged, and the argument is still standing. How much weight that carries is another matter. Two quarters from the shock is the window I would want, which does not close until the third quarter of 2026. The August index publishes on 4 September 2026 and it is the next instalment of the same test. If the next couple of monthly releases show the individual lines converging, and in particular if the dairy line starts climbing back toward the rest, I am wrong and the old playbook comes back.
The second thing that would make me wrong is slower and more likely. Buying groups are consolidating, and I would expect the job of comparing thousands of supplier contracts at once to get much cheaper, because that is the kind of work the current wave of software is good at. I have not seen a buying group actually do it. But that capability is what a buyer would need in order to hold two of your categories at the same time, and I would watch for the first alliance that starts negotiating a supplier's total position rather than a single category's. On the day that appears, the argument in this piece stops holding.
Which is also why I would not bank too heavily on that information advantage. A procurement team only has to work out what one supplier's costs are doing. You have to do it across every customer and every category you sell into, which is the harder end of the same problem.
The pushback I expect
"My buyer never knew my other categories' costs anyway, so nothing has changed."
This is the strongest objection and it is half right. Buyers have always worked one category at a time, and you have always faced them that way. What changed is what that narrow view now leaves out. When all your inputs moved together, a category view and a portfolio view produced roughly the same answer, so the way buying is organised cost you nothing. Now the two views produce materially different answers, and you absorb the difference on every negotiation. Your buyer's blind spot has been there all along, and until recently it was free.
"This is just an argument for holding price and hoping."
No, and it should not be read that way. It is an argument for moving expected value out of a lever that has weakened and into levers that have not, and for scoring your categories on whether you keep a cost move rather than on the cost move alone. That is a reallocation, and a reallocation is a decision with a number attached.
Signals
- Vegetable oils sat 17.3 percent above their year-earlier level in July 2026 while dairy sat 24.8 percent below, with the headline index up just 1.0 percent. https://www.fao.org/worldfoodsituation/foodpricesindex/en/
- General Mills reported lower input costs in pet food and higher input costs in North America grocery in the same quarterly release. https://www.generalmills.com/news/press-releases/general-mills-reports-fiscal-2026-fourth-quarter-adjusted-results-in-line-with-company-expectations
- Lindt lifted group prices 11.8 percent in the first half of 2026 and gave up 7.5 percent of volume and mix to do it. https://www.lindt-spruengli.com/press-releases-and-news/english/lindt-sprungli-reports-solid-half-year-results-and-confirms-full-year-guidance-2026/
- Joining a European buying alliance was worth 36 percent lower shelf prices in frozen food but only 6 percent in snacks, at the same retailer. https://papers.ssrn.com/sol3/papers.cfm?abstract_id=4139152
- Simon-Kucher warns that treating a selective cost shock as "just another flavor of inflation" means applying tools built for a different problem. https://www.simon-kucher.com/en/insights/tariff-pricing-strategy
References
- FAO Food Price Index, July 2026, released 7 August 2026. All changes year on year; the vegetable-oil and June comparisons are computed from FAO's own published index series, downloadable from the same page. https://www.fao.org/worldfoodsituation/foodpricesindex/en/
- World Bank, Commodity Markets, chapter 3, box 3.2. https://thedocs.worldbank.org/en/doc/b4ff84b2d5dc4d0963a5074102460cc1-0350012022/related/Commodity-Markets-Chapter-3.pdf
- General Mills, fourth quarter fiscal 2026 results, quarter ended 31 May 2026. https://www.generalmills.com/news/press-releases/general-mills-reports-fiscal-2026-fourth-quarter-adjusted-results-in-line-with-company-expectations
- Marcel Corstjens, International Retail Buying Groups: A Force for the Good? The case of AgeCore/EDEKA, INSEAD working paper 2022/30/MKT, June 2022, on checkout data from 2014 to 2019. https://papers.ssrn.com/sol3/papers.cfm?abstract_id=4139152
- Danone, first half 2026 results, 29 July 2026. https://www.globenewswire.com/news-release/2026/07/29/3334969/0/en/Danone-Strong-Q2-performance-and-solid-H1-results-demonstrating-the-relevance-of-our-health-focused-portfolio.html
- Marcel Corstjens, Myths about Grocery Retailers and their Retail Buying Groups, INSEAD working paper 2025/03/MKT, table 6, covering 2019 to 2022. https://sites.insead.edu/facultyresearch/research/doc.cfm?did=73610
- Simon-Kucher, Tariffs: uneven ripples, clear strategy, and the accompanying leadership guide Tariffs, Pricing, and Power, 2025. https://www.simon-kucher.com/en/insights/tariff-pricing-strategy
- Simon-Kucher, How to navigate the new pricing cycle in CPG: a strategic guide for leaders. https://www.simon-kucher.com/en/insights/how-navigate-new-pricing-cycle-cpg-strategic-guide-leaders
- Lindt and Spruengli, half-year results 2026, 21 July 2026. https://www.lindt-spruengli.com/press-releases-and-news/english/lindt-sprungli-reports-solid-half-year-results-and-confirms-full-year-guidance-2026/
- Simon-Kucher, The rise of private label: why brands must redefine their worth, drawing on its Global Shopper Study 2026. https://www.simon-kucher.com/en/insights/rise-private-label-why-brands-must-redefine-their-worth
- Daniel Kahneman, Jack Knetsch and Richard Thaler, Fairness as a Constraint on Profit Seeking: Entitlements in the Market, American Economic Review 76(4), 1986. https://econpapers.repec.org/RePEc:aea:aecrev:v:76:y:1986:i:4:p:728-41
- FAO, "FAO Food Price Index edges down amid diverging commodity price movements", the June 2026 release, 3 July 2026. https://reliefweb.int/report/world/fao-food-price-index-edges-down-amid-diverging-commodity-price-movements